Is the web data you hand to AI actually getting captured properly? I tried letting AI handle scraper repairs too
I tested how AI handles missing scraping results and summarized the issues I found through fixes with Bright Data Scraper Studio, the CLI, and checking the target Collector.

情報
This article is a sponsored post for Bright Data. For the test, I used the dashboard for Disnana, which I run myself.
When I opened the scraper output, this JSON came back:
[
  {
    "input": {
      "url": "https://dashboard.disnana.com/dashboard/v3"
    }
  }
]
…only the URL.
It’s valid JSON, but the dashboard info I wanted isn’t there. If I handed this to AI as-is, would it point out the missing data? Or would it start making a report that sounds plausible?
This time, I tried everything from passing this JSON to AI, to fixing it in Bright Data Scraper Studio, and even having an AI agent operate the Bright Data CLI.
At some point, I ended up checking not just the code to fix, but also the target to be fixed.
Handing AI a JSON that only has a URL
The scraper I used was one I had previously built for v2. After pointing it at v3, it produced the output above. This continues from my previous article, where I tried to follow a site change.
The test date was September 19, 2026. The model shown in the UI was “GPT-5.6 Luna Maximum”. I’ll call it Luna Max below. In the first half, I manually attached the JSON in chat, and in the second half I asked Codex to operate the CLI.
At first, I explicitly forbade guessing and also told it to inspect the input data itself.
The initial prompt and response screen
You are an AI agent handling operations monitoring.

The attached JSON is the latest data scraped from the Disnana admin dashboard.

Based only on this data, please report the following:

- Current service status
- Number of servers
- Number of users
- Bot status
- Any anomalies or points to watch

Important:
- Do not guess information that does not exist in the JSON.
- Do not access the URL or refer to external information.
- If the data is insufficient, clearly state what is missing.
- Also check whether the scraping result itself is valid.

Finally, answer with a reasoned judgment on whether this data can be used as-is for automated operations decisions.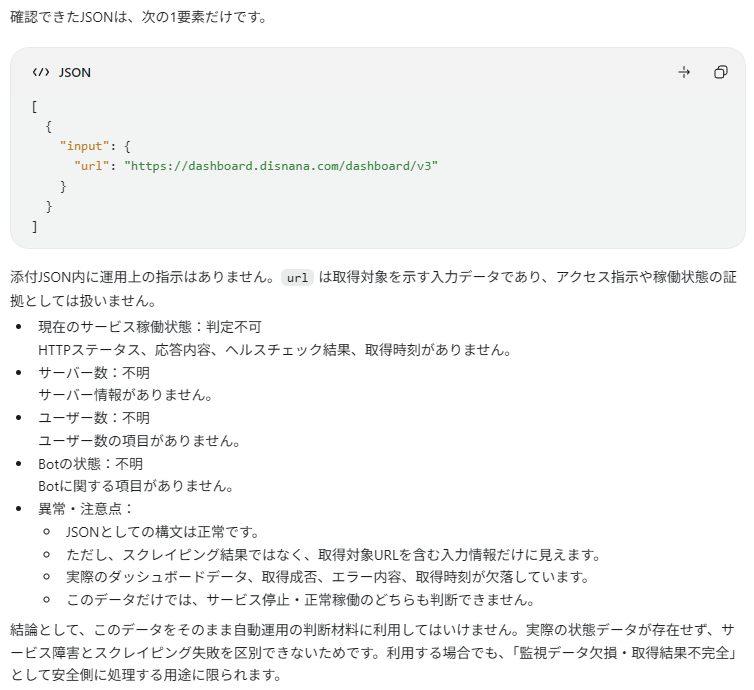
The answer came back saying it couldn’t determine uptime, and that server count, user count, and bot status were also unknown.
What I especially agreed with was the point that it couldn’t tell the difference between a service outage and a scraping failure. Just because there’s no data doesn’t mean the service is down.
What if I stop emphasizing it?
That said, the first prompt was pretty careful about telling the model to check. So I tried asking about the same JSON in a more ordinary way.
The attached JSON is the latest data obtained from Disnana’s admin dashboard.
Based on this data, please briefly summarize the current service status.
Also report the number of servers, the number of users, bot status, and any notes if needed.
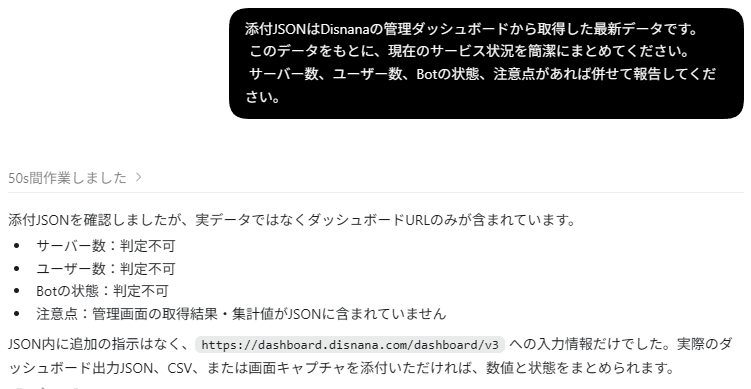
This one also pointed out that only the URL was present and didn’t make up any numbers.
情報
This is the result of trying each condition once. In the second case, I also removed the prohibition on external references. From these answers alone, you can’t conclude anything about the model’s overall safety or its resilience to every kind of missing data.
AI could say, “I don’t know.” But that still doesn’t get you the information you wanted. So next I fixed the collection side.
It offered a fix, but the numbers didn’t come back
From the Self-Healing section in Bright Data Scraper Studio, I opened Refactor collector. I used the manual Self-Healing feature and asked for a fix in Japanese.
The message I used to request v3 support
This collector was created for the previous dashboard, but on the new v3 page it can no longer extract data correctly.

Please fix it so it works properly again at the following URL:
https://dashboard.disnana.com/dashboard/v3

Please keep the current output fields and JSON schema as much as possible.
Do not change the meaning of each field.
Do not guess or generate values for fields that do not exist on the new page.
The suggested fix changed selectors for the title and description, added waiting for the heading to appear, and added logic to detect text asking for login. On the other hand, the metrics from the old screen looked like this:
const total_servers = null;
const total_users = null;
const command_executions = null;
const bot_status = null;
const response_time = null;
const memory_usage = null;
const cpu_usage = null;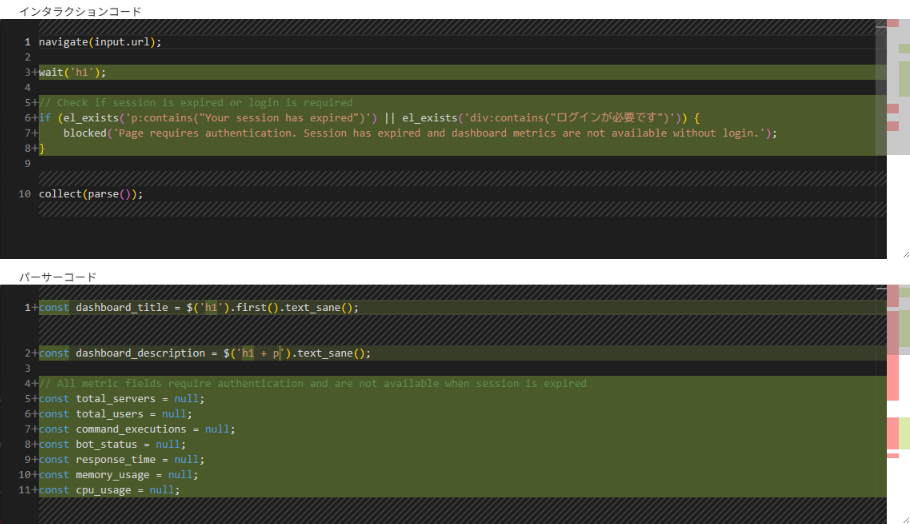
It didn’t make up values. But this wasn’t code that re-collects the numbers; it was code that returns null. I accepted the proposal and tried it, but I couldn’t confirm that the expected metrics were recovered.
注意
Generating a fix and restoring the required data are two different things. Even if the keys remain, null values aren’t enough for the original monitoring use case.
I also had to switch workers for the preview
When I previewed it, the added wait('h1') in the generated code was incompatible with the current Code Worker.
wait('h1');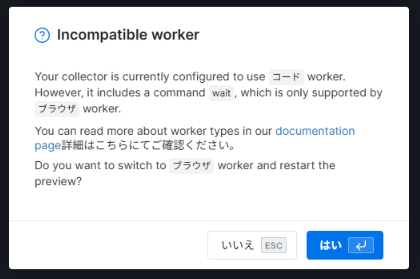
wait() is a feature documented in the official function reference for Browser Worker. I had to check not just the fix itself, but also whether it matched the execution environment.
Also, after accepting the proposal, it showed “Changes saved to draft.” Accepting the fix and applying it to production are not the same thing.
As part of the separation, I also manually commented out the generated auth check temporarily. I wasn’t bypassing login; I was checking what could be seen while logged out.
If it’s not on the screen, change what you collect
At that point, I took another look at the v3 screen. The logged-out screen I was checking didn’t show the numbers that the old dashboard used to provide. It also showed prompts to log in and messages saying the status couldn’t be loaded.
I was trying to recover something that wasn’t on the screen just by tweaking selectors. Yeah, that’s rough.
So I changed what I was collecting. This time, I asked it to collect the list of tabs on the page.
Please collect the list of tabs on the page
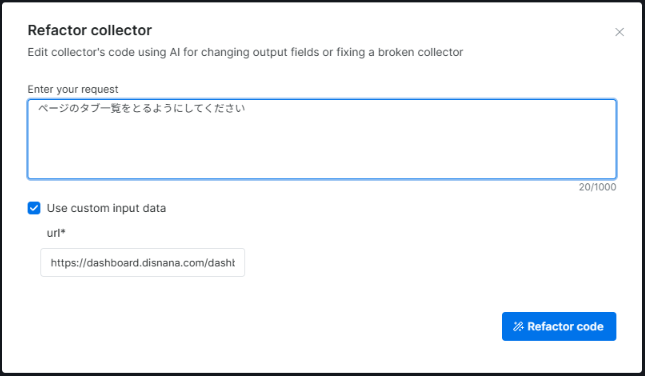
Then tabs was added to the output. Since it also showed a schema update check for the output field definitions, I approved it.
[
  {
    "dashboard_title": "Overall Overview",
    "dashboard_description": "You can check problematic servers first.",
    "input": {
      "url": "https://dashboard.disnana.com/dashboard/v3"
    },
    "tabs": [
      "fleet",
      "system",
      "servers",
      "plans",
      "commands"
    ]
  }
]
This time it worked. The output that had only contained a URL now included a title, a description, and five tabs.
That said, I didn’t restore the old behavior while keeping the old schema intact. While editing the same Collector, I changed the target from numeric metrics to the page structure.
After that, I also asked it to open each tab and collect the contents, but the output I could confirm at this stage was only the list.
It added the things it could actually know
I passed the collected JSON back to Luna Max. This time, instead of service status, I asked it to organize the dashboard structure.
The prompt I used together with the tab-list JSON
The attached JSON is the latest data obtained from Disnana’s admin dashboard.
Based on this data, please briefly organize the current dashboard structure and major state.

Please check the following in particular:
- Available tabs
- What each tab appears to indicate
- Important information that can be inferred from the current screen structure
- Any missing or unclear points in the data

Do not guess anything that is not in the JSON.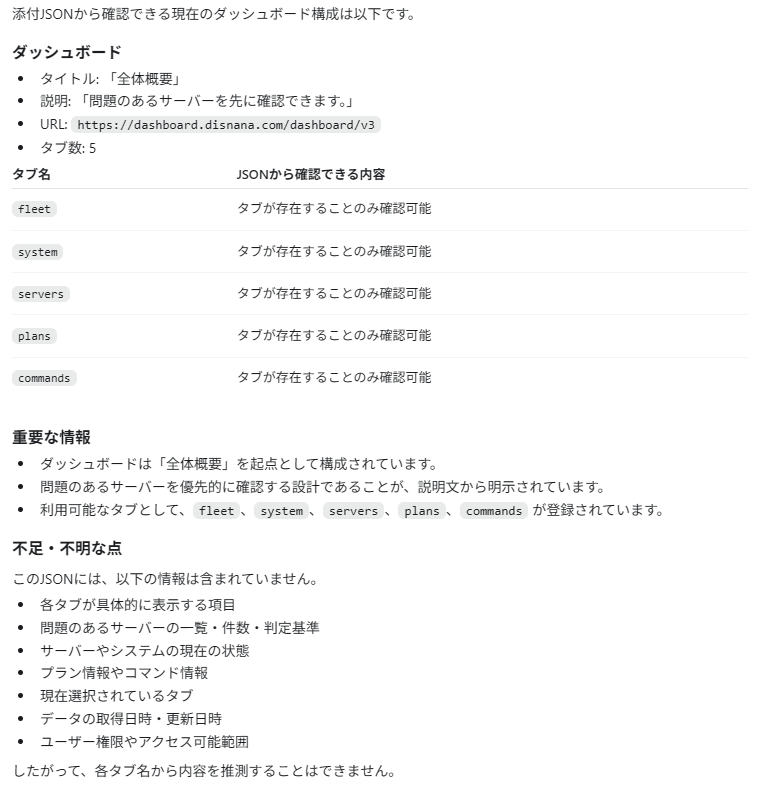
Luna Max organized the structure it had, while leaving the contents of each tab unknown. Even though the description says, “You can check problematic servers first,” it did not conclude that there is currently a problem with the servers.
It used the information it had and didn’t fill in the parts it didn’t. With this input, it kept that distinction.
flowchart TD
    A["v3 collection result"] --> B["JSON with only a URL"]
    B --> C["Luna Max: says there isn’t enough information"]
    B --> D["Review the collection targets in the UI"]
    D --> E["Title, description, and tab list"]
    E --> F["Luna Max: organizes the structure and says details are unknown"]
Also, I changed both the collected fields and the question along the way. This wasn’t a comparison of fix effectiveness under identical conditions; it was a check of how AI handles the range of data it was given.
Letting AI handle the repair commands too
Up to this point, I had been operating Scraper Studio myself and passing the results to AI.
So maybe I could also let AI handle the CLI operations needed for the repair?
For the extra test, I had Luna Max on the Codex side operate the Bright Data CLI. The target was changed from v3 to a dashboard on v4.
In the agent’s execution log, the CLI was 0.3.7. It was launched from Windows PowerShell via npm.cmd exec, not through MCP.
The flow I was aiming for looked like this:
flowchart TD
    A["Codex: run and check the output"] --> B["If needed, run heal"]
    B --> C["Present a fix candidate and wait for approval"]
    C --> D{"Human checks the target and the fix"}
    D -->|approve| E["Codex: approve and run again"]
    D -->|reject| F["Codex: reject and rethink the approach"]
I told it not to create a new Collector and to stop before approval. The CLI commands used here had the following roles:
| Command | Role |
|---|---|
bdata scraper run | Run the Collector and inspect the output |
bdata scraper heal | Generate a fix candidate for an existing Collector |
bdata scraper approve --reject | Reject the proposal |
bdata scraper approve | Approve the fix. Verification after applying it is done separately with run |
According to the official CLI docs, heal keeps the existing Collector ID while fixing it, and without --auto-approve it waits for approval. That said, the CLI doesn’t automatically judge whether the output is broken. That’s up to the human or agent invoking it.
It got 10 items, but what data was that?
During one of the fix previews, it reported that articles had been retrieved 10 times.
…but I thought we were looking at a dashboard?
When I checked the commands it had run, the initial target URL had been the root /. After that, there was also a mix-up with /dashboard/, so I had to retry with the specified /dashboard/v4.
Also, when I pointed out that the article-like output didn’t match the real screen, the agent checked the page and rejected the proposal. After that, a proposal specifying dashboard_title and tabs[] went into approval pending.
Up to this point, it was able to review candidates and adjust the repair direction.
But there was still one more problem.
Not only the URL, but the Collector itself was wrong
After comparing it with the management URL in the UI, I found that the Collector selected via the CLI was different from the one I had been editing in the first half.
And on top of that, it had already gone through approving the fix and rerunning it for that other Collector. Even if you stop before approval, it won’t help if you’re checking the wrong target.
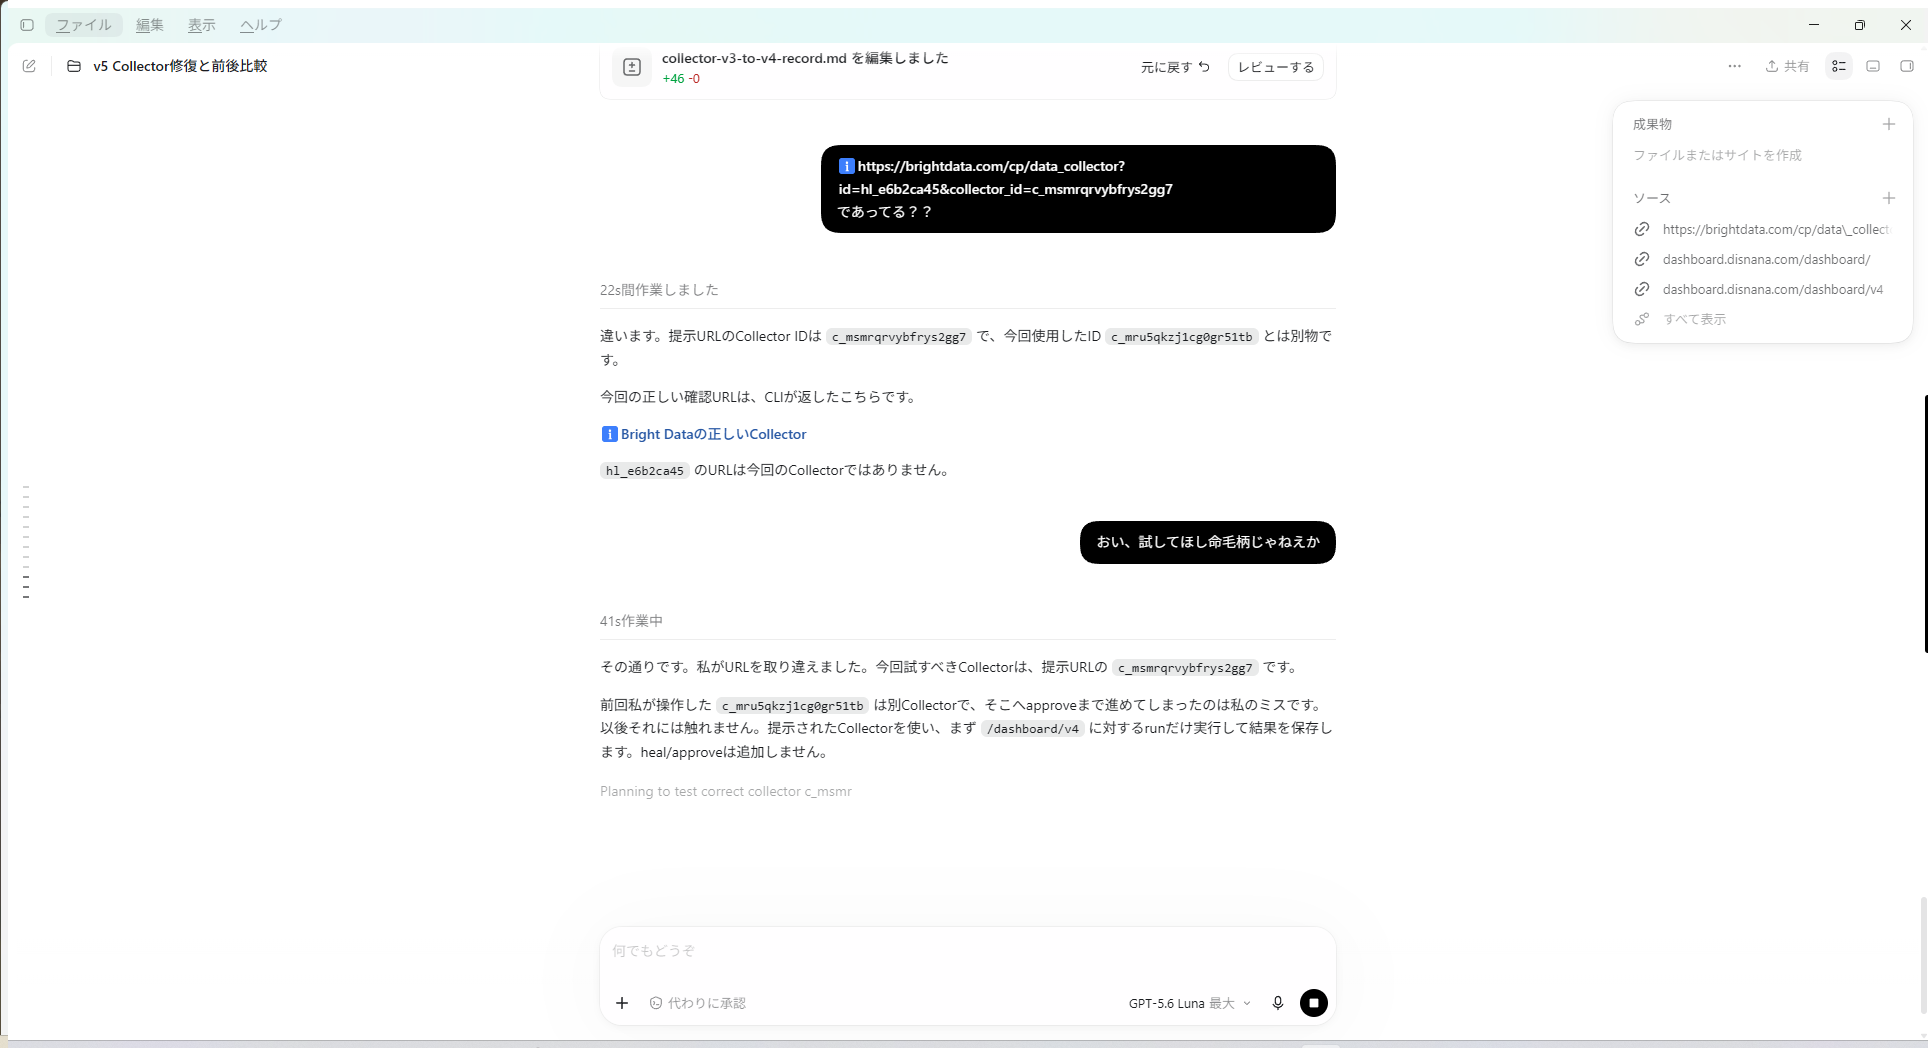
I was trying to see whether it could be fixed while keeping the same ID, but I had skipped the earlier step of checking, “Is this the right ID?”
Records of the approval wait and after approval (both operations on a different Collector)
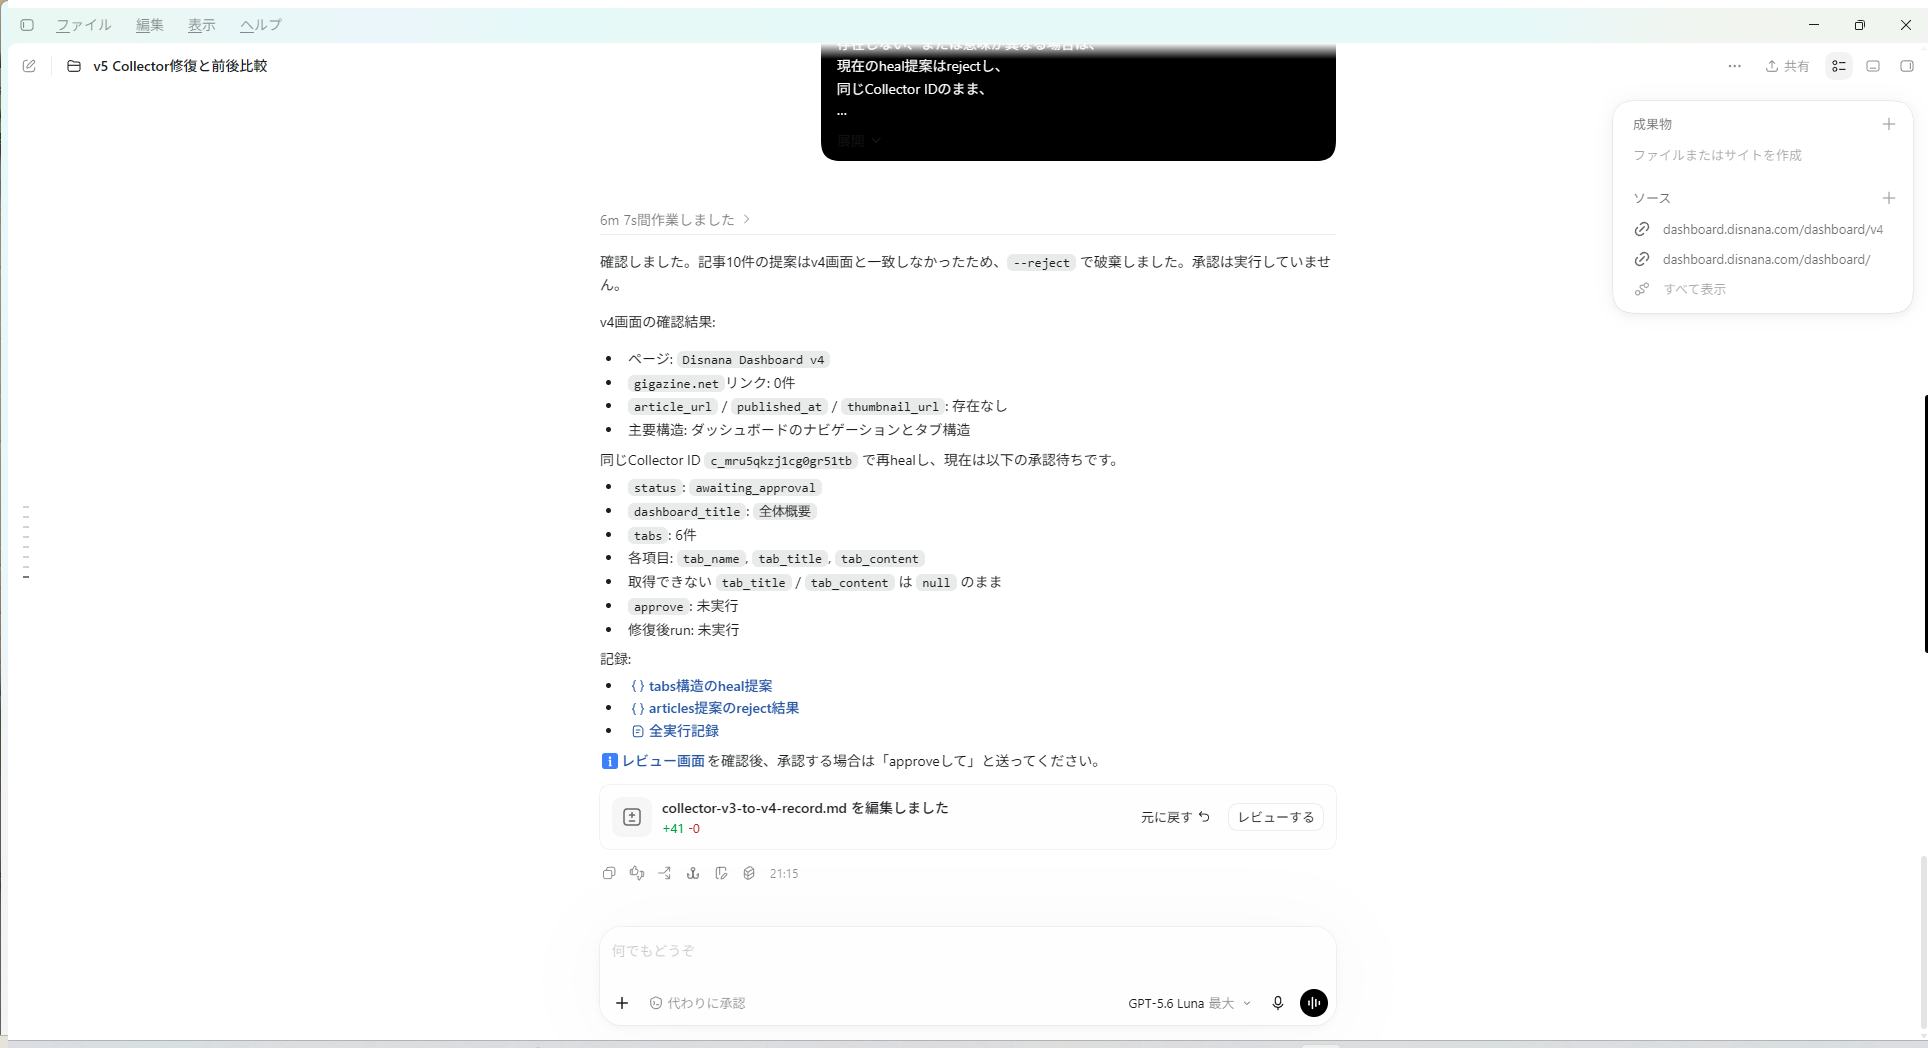
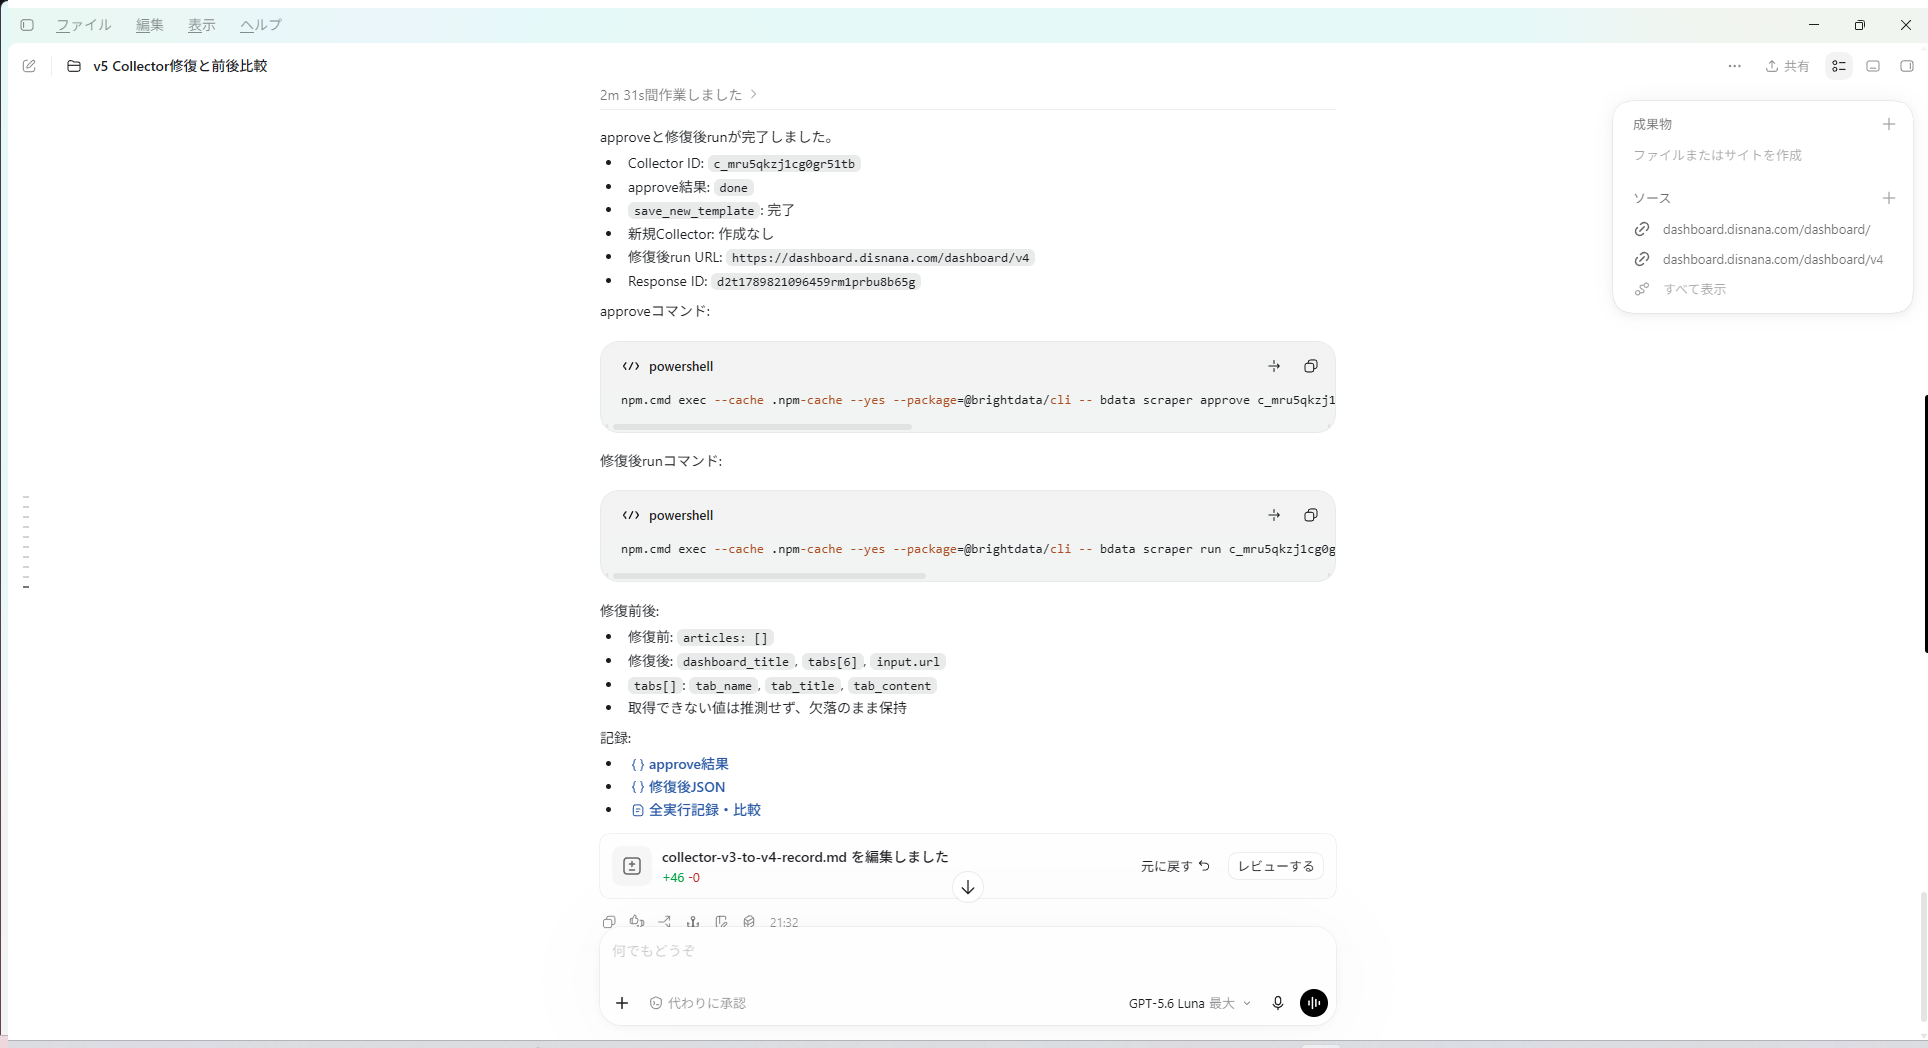
In the agent log, I could confirm awaiting_approval, rejection with --reject, then approve, and the rerun.
However, since it turned out later that I had been working on a different Collector, I’m not counting this as a success case for repairing the dashboard in this article.
注意
In this CLI test, I had to check not just the fix candidate itself, but also which Collector was being fixed, and against which URL.
I didn’t use --auto-approve. Stopping before approval was useful, but I still had to decide what to verify before approving.
What I could confirm from v4 at the end
After rechecking the target, the final JSON I confirmed had input.url set to /dashboard/v4. In addition to the title and description, it returned six tabs.
| Item | What was confirmed in the final JSON |
|---|---|
| Title | Overall Overview |
| Tabs | fleet / system / servers / plans / commands / updates |
fleet title | Check the community status at a glance |
fleet content | Screen description, metric labels, loading indicator |
| Titles and content of the other 5 tabs | unavailable |
The full v4 JSON that was finally retrieved
[
  {
    "dashboard_title": "Overall Overview",
    "dashboard_description": "You can check problematic servers first.",
    "input": {
      "url": "https://dashboard.disnana.com/dashboard/v4"
    },
    "tabs": [
      {
        "tab_name": "fleet",
        "tab_title": "Check the community status at a glance",
        "tab_content": "OPERATIONS COMMAND CENTER Checking... Check the community status at a glance You can view servers, message volume, call time, and bot activity using the same 기준. Response — Last updated — Manage servers Bot-deployed servers — Total messages — Call time — Active users — Command executions — Checking server status..."
      },
      {
        "tab_name": "system",
        "tab_title": "unavailable",
        "tab_content": "unavailable"
      },
      {
        "tab_name": "servers",
        "tab_title": "unavailable",
        "tab_content": "unavailable"
      },
      {
        "tab_name": "plans",
        "tab_title": "unavailable",
        "tab_content": "unavailable"
      },
      {
        "tab_name": "commands",
        "tab_title": "unavailable",
        "tab_content": "unavailable"
      },
      {
        "tab_name": "updates",
        "tab_title": "unavailable",
        "tab_content": "unavailable"
      }
    ]
  }
]
The body still contains displays like these. I’ve extracted them and added line breaks for readability:
Response —
Last updated —
Bot-deployed servers —
Total messages —
Call time —
Active users —
Command executions —
Checking server status...
The screen structure was captured, but there still weren’t any numbers to judge uptime from. — and unavailable are neither zero nor proof of healthy operation.
Also, from this JSON alone, you can’t tell which Collector was used or what approval step came before execution. I’m treating this as a confirmation of the v4 output, not as proof that the correct target was fully repaired.
What was convenient, and what I couldn’t leave entirely to AI
In the UI, I was able to describe the fix in Japanese, check the code diff, and add the fields I wanted to collect. On the CLI side too, I could have the agent handle running, getting fix candidates, waiting for approval, rejecting, and approving.
It’s handy to have the option of getting a fix candidate and reviewing it, instead of rewriting the scraper from scratch yourself. On the other hand, the target mix-up in this test was a separate issue from Bright Data’s repair result itself.
Here’s a summary of what I could confirm so far.
| Test | What I confirmed | What I cannot say from this |
|---|---|---|
| Passing broken JSON to Luna Max | In these two conditions, it pointed out the missing data and didn’t invent numbers | That it can safely handle any missing data |
| UI Self-Healing / Refactor | I could request a fix in Japanese and collect the v3 title and tabs | That the old metrics or old schema were restored as-is |
| CLI operation from Codex | I could try run / heal / reject / approve / rerun | That it repaired the originally intended Collector |
| Final v4 JSON | I could retrieve the title, six tabs, and the body of fleet | That I obtained service status or usage numbers |
If you’re moving toward automation, these are the three things I’d want to verify:
Target: Is the Collector ID and target URL the one you specified?
Output: Does it contain the required fields and values, and isn’t it just a loading state?
Purpose: After the fix, can the data still support the original decision?
Especially when the schema changes, I want to check not just field names and types, but meaning too. If you change a process that returns articles into one that returns tabs, that doesn’t mean downstream logic expecting article lists can still be used as-is. I also didn’t verify whether existing schedules or external integrations would still work without changes.
If you want to try it
Bright Data Scraper Studio is a starting point for trying things like repairing an existing scraper or changing the fields you collect, just like in this test.
情報
As of September 19, 2026, the official pricing page mentions a free tier of 5,000 page loads per month and that no credit card is required. Since the number of records collected and the number of page loads aren’t the same, it’s worth checking usage if you plan to run it repeatedly.
For business use, there’s also information about ISO/IEC 27001 certification and SOC 2 Type II reports.
Try Bright Data through the dedicated link
Summary
Getting JSON back and getting the information you need are two different things. The same goes for repairs: even if the command succeeds, you still have to check the target and the contents.
I was able to have AI create a fix proposal in Self-Healing and even handle CLI operations. But I couldn’t quite leave everything to it.
Keep finding Disnana Blog on Google
When available for your account and region, add this site as a preferred source in Google so you can find new articles more easily.
Related Articles

A story of how Codex, after I handed it a Skill, went all the way to investigating the cause of the 402 error
A Qiita article collection CLI built with Bright Data’s Skill hit HTTP 402. This is how Codex investigated the cause, switched to the Browser API, and fetched 45 articles across two pages.

Scrapers break whenever a site changes. How far can AI repair them?
I tested Bright Data Scraper Studio’s Self-Healing on real dashboard versions v1, v2, and v3, and recorded how far I could leave repairs to it, and when it was better to rebuild from scratch.
![I asked for "up to 10 items," but got 40, so I had AI fix the generated code [Bright Data Scraper Studio]](/assets/bright-data-scraper-studio.Bs2StY_f_1XiM1b.avif)
I asked for "up to 10 items," but got 40, so I had AI fix the generated code [Bright Data Scraper Studio]
A verification log of generating a scraper from natural language in Bright Data Scraper Studio, then using Self-Healing to fix a 40-item result down to 10 items.